Success in boxing is dependent on the ability to continually improve performance. To achieve this, coaches must be able to analyse the boxer’s actions and understand what they have done to produce either a successful or unsuccessful performance. Traditionally coaches rely on what they observe in real-time to make their analysis, however research shows that on average, coaches and athletes can only recall about 30% of the performance correctly, and that subjective observations are likely to be unreliable and inaccurate. Bias, limitations of memory and observational difficulties are just a few of the pitfalls associated with subjective evaluations. Thus, successful coaching and performance improvement hinges on the collection and analysis of unbiased, objective data.
Performance Analysis
Performance Analysis is a specialist sports science discipline involving systematic observations that can improve tactics, technique, movement, and decision making, primarily through the provision of objective statistical and visual feedback which provides valid, reliable and detailed information.
Early analysis of boxing performance – Tyson v Bruno 1989
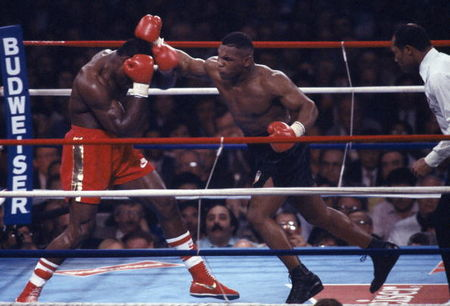
One of the earliest examples of post-event boxing performance analysis was the 1989 world heavyweight title fight between Mike Tyson and Frank Bruno at the Hilton International in Las Vegas. Analysing the fight, which Tyson won by way of a fifth-round technical knockout, the researchers first watched the fight through completely to get a feel for the punch speed, and to identify any differences that exist in their boxing styles – Bruno, a stiff and upright boxer who relied on his long reach and jab, and Tyson, a short toe-to-toe fighter who battered his opponents with scything hooks and uppercuts. The fight was then analysed using the pause function on the video recorder and, at instances when numerous punches were thrown within a very short period, by frame by frame analysis.
 Figure 1. Frank Bruno and Mike Tyson during their 1989 contest.
As the researchers were using hand-notation – a manual recording system, they decided that only offensive actions and specific key features should be recorded. These variables were identified as: jabs; misses; knockdowns; hooks; body shots; uppercuts and holding. The system was then progressed to separating the punches into left and right sides depending on which side they were thrown from. Symbols were then designed to represent the variables to make the data easier to collect:
|
Variable – Punch or Action |
Symbol Left | Symbol Right |
|
Jab |
-| | |- |
|
Hook |
( |
) |
|
Uppercut |
UL |
UR |
|
Body punch |
B |
B |
|
Miss |
m |
m |
| Holding | < |
> |
| Knock down | v |
v |
Table 1. Variables identified, and symbols used to hand-notate Tyson v Bruno
Figure 2. The number of types of punches thrown over the five rounds – Tyson v Bruno 1989.
From the analysis the researchers identified that Bruno threw 55 per cent of the punches, however when they broke the data down round by round, they observed that in the first three rounds he threw more than Tyson, and in rounds four and five Tyson threw more than Bruno, suggesting that as Bruno tired, Tyson took control of and ultimately won the fight in the fourth and fifth rounds. See Figure 2 below.
Figure 3. Total punches thrown by both boxers in each round – Tyson v Bruno 1989.
Bruno’s most effective punch was the jab and the analysis showed that over the first three rounds his jabbing more than doubled Tyson’s, however, during rounds four and five Bruno’s jabs decreased dramatically and let Tyson get in close to punish him with his powerful hooks and uppercuts.
Figure 4. Total number of jabs thrown by both boxers in each round – Tyson v Bruno 1989.
Although the analysis system developed for the Tyson versus Bruno fight was simplistic, and only accounted for a limited number of variables, it did prove that detailed and accurate notation and analysis of a boxing contest was possible. However, the researchers did recognise the limitation of the study and acknowledged that it did not address many of the key aspects of the fight that would facilitate future technical improvements and tactical strategies for the boxer, specifically – ring movement, punch combinations and defensive actions.
Current boxing analysis and data collection services – CompuBox v Intelligent Boxer
More recent attempts to quantify boxing performance has carried out by two organisations in particular – CompuBox and Intelligent Boxer. Among the services listed on its website CompuBox states that it ‘provides real-time statistical data for all major boxing fights’, and has developed software that categorizes punches into Jabs (thrown and landed) and Power Punches (thrown and landed). Jabs and Power Punches are combined to create Total Punches thrown and landed. The data is collected by two human operators, each observing a different fighter.
Table 2. CompuBox analysis variables – Power Punches, Jabs and Total Punches.
Established in 1985 with clients including HBO, CBS/Showtime, NBC Sports Network and Top Rank PPV, CompuBox claim that their ‘stats in no way, shape or form, determine a winner of a fight’, and that they are used to ‘enhance a telecast, show the estimated barometer of activity by both fighters and paint a picture of the activity on a round-by-round basis’. As implied, CompuBox is a tool that provides real-time data aimed at commentators, studio analysts and boxing fans. However, real-time quantification of a dynamic sport such as boxing is almost impossible to accurately notate. The subjective nature, potential for error and lack of boxing specific analysis variables makes it a tool unsuitable for objective feedback and performance improvement.
Intelligent Boxer on its website states that it is a ‘boxing collective dedicated to bringing original, intelligent, factual, and verifiable boxing analysis’. Using what it describes as the ‘alpha version of Smart Stats, a smarter, fine grained, punch tracking engine’. They offer the following analysis information:
- Full punch type support. Jab, cross, hooks, uppercuts, body jab, body cross, body hooks, and body uppercuts. With this information we can provide the fighter’s most effective punches across rounds, how often they went to the body versus the head, where each fighter took the most damage, and much more.
- Second resolution punch tracking enables us to show how the punches came in the round, how active a fighter was in the first minute vs the last minute, down to nearly the second.
In addition, they say that the Smart Stats engine:
- Assumes mistakes will be made and allows easy editing for redoing misread punches.
- Supports live and post-fight punch tracking at multiple playback speeds.
- Automates a suite of easy to understand graphs and statistics.
Intelligent Boxer states that its data ‘should help to compliment and support fans and judge’s views of the fight – not replace it’. However, they add that their system is still a work in progress with ‘computer vision still not there, we’re moving forward with manually transcribing the fight with a focus on accuracy.’ Nevertheless, it’s a step in the right direction for providing meaningful performance analysis that enables coaches and boxers to understand where the fight was won or lost and develop strategies for future performances improvements.
Although both CompuBox and Intelligent Boxer aim to provide accurate and verifiable data, it is the later that has embraced the sports science approach with regards to quantifying boxing specific variables. In the recent Canelo Alvarez and Gennady Golovkin contest at the T-Mobile Arena in Las Vegas, they collated and produced a comprehensive set of data and graphs that enabled commentators, fans, coaches and boxers to drill into the detail and obtain a better understanding of the performance of both fighters. Although, like the Tyson v Bruno analysis, movements and defences were not accounted for the following punch types were:
| Lead Jab | Lead Jab Body | Rear Cross | Rear Cross Body |
| Lead Hook | Lead Hook Body | Rear Hook | Rear Hook Body |
| Lead Uppercut | Lead Uppercut Body | Rear Uppercut | Rear Uppercut Body |
Figure 5. Punching variables identified and analysed by Intelligent Boxer – Alvarez v Golovkin 2017
In a round by round analysis of the same fight, Intelligent Boxer produced three detailed sets of data per round, captured and presented in graph format, including: Punch Output – quantity per second; Punches Thrown – quantity per variable; and Punches Landed – quantity per variable. See Figures 6, 7 and 8 below for details.
Figure 6. Punch Output – Time v Count, Round 1 – Alvarez v Golovkin 2017
Figure 7. Thrown Punches – Total per punch type, Round 1 – Alvarez v Golovkin 2017
Figure 8. Landed Punches – Total per punch type, Round 1 – Alvarez v Golovkin 2017
CompuBox also carried out their own analysis and produced their own set of data for the same contest, and as expected there was some disparity between the data. For example, the total punches thrown for the complete fight recorded by CompuBox was 703 for Golovkin whereas Intelligent Boxer totalled 839. Likewise, for Alvarez, CompuBox totalled 505 punches and Intelligent Boxer counted 552. The discrepancy between the two sets of data highlight the difficulties involved with quantifying boxing performance especially when it involves the real-time analysis of two of the world’s best boxers. See Figure 9 below for a comparison of the available data from CompuBox and Intelligent Boxer for the Alvarez verses Golovkin fight.
Figure 9. Comparison between analysis data produced by CompuBox and Intelligent Boxer.
The way forward for performance analysis of boxing.
The details above reinforce the difficulty in quantifying boxing performance in both real-time and post-event analysis. Manual or hand-notation is a laborious and time-consuming task that requires skilled and diligent observers. However, other sports have embraced available software and technology that reduces time and error and provided a wealth of sports specific performance data. Once such software package already being utilised by elite level amateur boxers is Dartfish.
Figure 10. Dartfish Software for boxing and other combat sports.
Developed by the Swiss Institute of Technology in Lausanne, Dartfish is an award winning integrated solution across multiple platforms that allows users to capture videos, tag real-time events, upload, organize and share the information via Dartfish TV channel. The software is used by coaches to break down and analyse the movements by using digital video graphics to deliver instant visual feedback.
Although boxing has been around since it was introduced into the ancient Olympic Games in 688 BC it has lagged behind other sports in utilising the advances in sports science and technology. Boxers regardless of experience or ability will only develop and improve through objective analysis and feedback of their performance. Most boxers are hungry for information and knowledge. Accurate and reliable performance analysis can provide the small adjustments to technique and tactics that can propel them to the next level. The more coaches and boxers that come to understand that analysis systems will improve the performance of both the boxer and the coach the better for it will be for the sport.
Sources:
Hughes, M. and Franks, I.M. (2008). The Essentials of Performance Analysis. New York: Routledge

